

.png)
Valuations are tricky for a lot of reasons, not in the least because if there are five different investors in a private company there will be five different marks. They’re also tricky because the investment team has one point of view, and the finance team has another, but the soundest valuations integrate multiple data points.
Sure, you need company revenue, but you also need performance commentary from the board deck and deal team notes, comp revenue multiples, holdings from the general ledger, and cap table data (usually from Carta).
Private market investing is often a collaborative effort, but not all collaborations perform equally. Knowing the performance of companies by co-investor can help determine which relationships you double down on.
To do this analysis, you of course need to be able to slice your IRR or MOIC by co-investors and by companies, which means you need KPIs, cap tables, and IRR or MOIC.
Knowing which companies are running out of cash isn’t complete data. What matters is knowing which companies are running out of cash that matter. This requires knowing which companies you have a board seat through the CRM, ownership percentage from the cap table, and seeing cash runway from KPIs. For example, you may decide to allocate reserves only to companies where you have a board seat and own 10% or more, or for other reasons indicated in a spreadsheet, if the company is a top priority.
By combining fund accounting data and reserves modeling, you can project the cadence and pace of calling and deploying capital against needs and priorities.
Multiples expand or compress depending on market cycles, sector growth expectations, and risk appetite. Investors often use forward revenue multiples based on projected revenue, rewarding future growth. The performance equation ends up being:
Being able to do this calc means having company KPIs as well as the investment performance.
“Adding value” means allocating the very valuable time of smart people who have experience solving the many problems that private companies encounter on their journey to an exit. The squeaky wheel analogy falls apart here, because just because a wheel is squeaking doesn’t mean it deserves attention. Identifying companies worthy of platform attention requires knowing revenue, investment cost, investment performance, board presence, ownership, and ideally a scenario model (eg project DPI and TVPI) that could indicate whether the company could “return the fund.”
All of this is to say that, sure, it’s important to collect KPIs. But once you have them, what do you do with them? How do you analyze them? What do you pair them with to make the big decisions that drive performance?
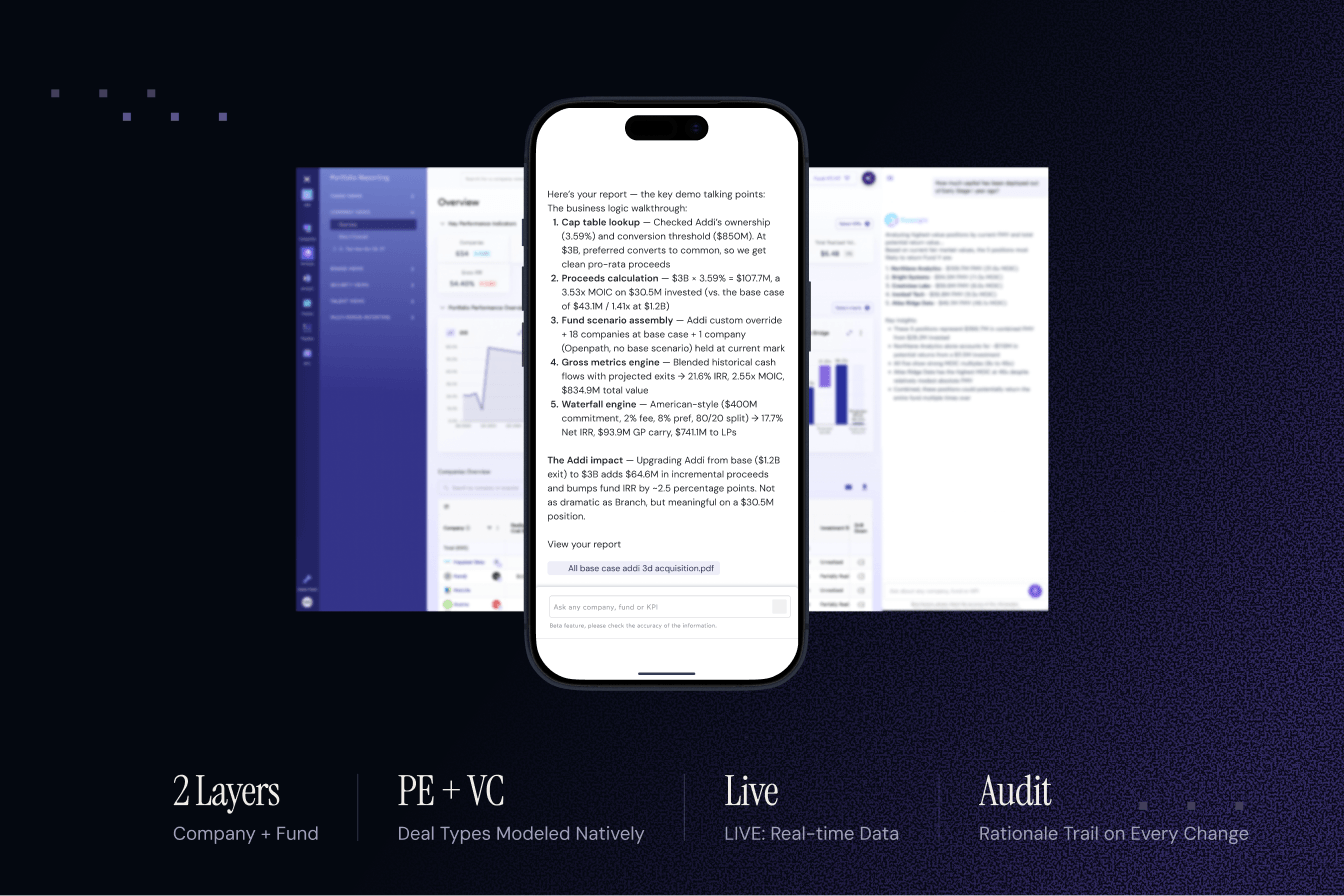
Foresight is the only platform on the market that delivers this caliber of data integration and native analytics. Click the purple "get a demo" button on the upper right of this page if you’d like to see these workflows brought to life in a live demo.
%201.svg)






%201.svg)
%201.svg)


%201.svg)